Financial services institution PNC Financial (NYSE: PNC) stock has retraced back down to oversold levels. The Company beat analyst estimates with inline revenues in its fiscal Q1 2022 earnings release. It’s commercial loans grew at the fastest organic rate since defensive draws started during the pandemic. Interest rate volatility climbed as the Russia and Ukraine conflict adversely impacts certain capital markets. The highest inflation spike in nearly four decades has prompted the U.S. Federal Reserve to forecast seven rate hikes this year. Banks are key benefactors from rising interest rates with increased loan demand. The Company is well-positioned to profit from rising interest rates with net interest income growth and expansion of net interest margin (NIM) expansion. The Company is set to reap the rewards of its prior BBVA acquisition as it sees 50% sales bumps in its branches. Prudent investors seeking exposure in a steady and consistent performing bank play can watch for opportunistic pullbacks in shares of PNC Financial.
MarketBeat.com – MarketBeat
Q1 Fiscal 2022 Earnings Release
On April 14, 2022, PNC Financial released its fiscal first-quarter 2022 results for the quarter ending March 2022. The Company reported earnings per share (EPS) profits of $3.29 versus $2.78 consensus analyst estimates, a $0.51 beat. Revenues rose 11.2% year-over-year (YoY) to $4.69 billion, beating analyst estimates for $4.72 billion. Net loan charge-offs were $137 million or 0.19% of annualized average loans. Net interest margin improved sequentially to 2.28% form 2.27% in prior Q4 2021 quarter. Average loans increase 1% YoY to $290.7 billion. Average commercial loans increase $1.8 billion. Average consumer loans of $95.1 billion were stable. Net loan charge-offs increased $13 million to $137 million. The Basel III common equity Tier 1 capital ratio was 9.9% as of March 31,2022, and 10.3% at December 31, 2022. The Company raised its quarterly dividend by 20% to $1.50 on April 1, 2022.
Conference Call Takeaways
PNC Financial CEO Bill Demchak gave an optimistic narrative of the bank starting the year with a solid start as it grew loans and securities, and controlled expenses while credit quality maintaining strong credit quality reserves and capital levels. Fees declined more than expected as Russian-Ukraine conflict impacted adversely affected certain capital markets. He looks forward to the increased benefits of rising interest rates with loan demand growth. Sales per branch were 60% in March 2022 than in December 2021 driven by improvements in mortgages, cards, and investment products. Commercial spot loans grew $6 billion in the quarter and $7 billion excluding the impact of PPP loan forgiveness and its rising into April. He elaborated on the stock buyback in the rising rate environment, “We also remain active on the security side with net purchases of almost $6 billion during the quarter. From a balance sheet perspective, the securities were offset by unrealized losses due to rising interest rates, which Rob is going to discuss in a few minutes. This doesn’t impact our regulatory capital or earnings, but during the quarter, we moved approximately $20 billion of our securities available for sale to help the maturity to limit future valuation changes due to interest rate movements. Importantly, we saw a solid rebound in the yield on our securities. Overall, we believe we are well-positioned for the rising interest rate environment to deliver net interest income growth and NIM expansion throughout the year.” 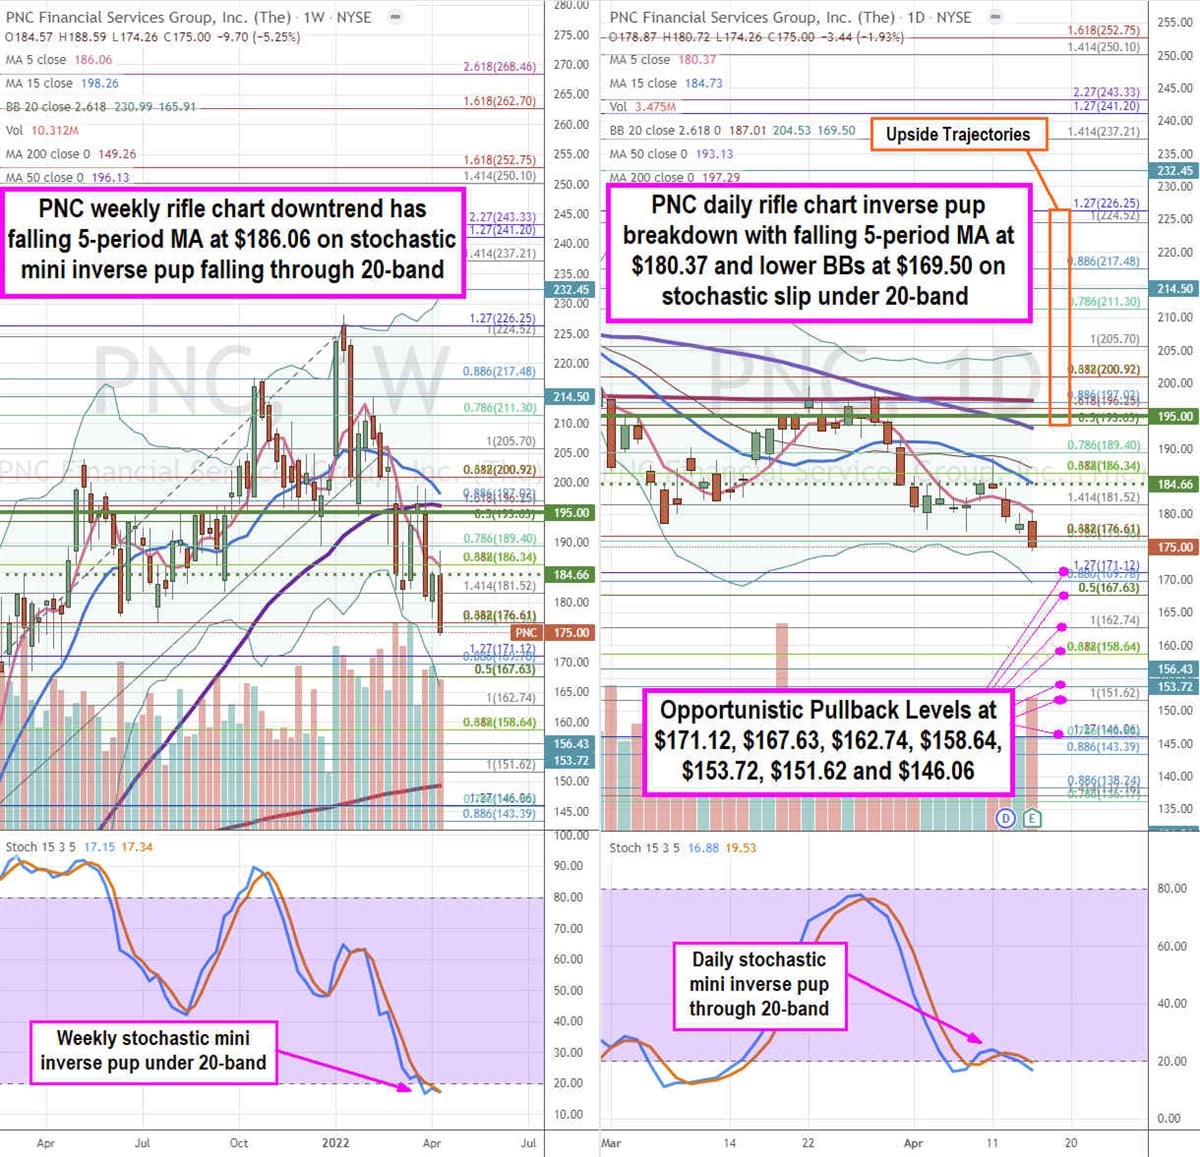
PNC Opportunistic Pullback Levels
Using the rifle charts on the weekly and daily time frames provide a precise view of the price action playing field for PNC stock. The weekly rifle chart formed an inverse pup breakdown through the $176.61 Fibonacci (fib) level and the weekly lower Bollinger Bands (BBs) sit near the $169.78 fib. The weekly 5-period moving average (MA) resistance is falling at $186.06 with 50-period MA at $196.13 and 15-period MA at $198.26. The weekly 200-period moving average support sits at $149.26. The weekly stochastic formed a stairstep mini inverse pup falling through the 20-band. The weekly market structure low (MSL) buy triggers on a breakout above $195.00 The daily rifle chart formed an inverse pup breakdown as the 5-period MA falls at $180.37 followed by the 15-period MA at $184.73 and daily lower BBs at $169.50. The daily 50-period MA resistance sits at $193.13 and 200-period MA resistance at $197.29. The daily MSL buy triggers on a breakout above the $184.66 price level. The daily stochastic failed the 20-band coil up and reversed to fall back under the 20-band on a stochastic mini inverse pup. Prudent investors can watch for opportunistic pullbacks at the $171.12 fib, $167.63 fib, $158.64 fib, $153.72, $151.62 fib, and the $146.06 fib level. Upside trajectories range from the $193.03 fib level up towards the $226.25 fib level.
How Dr. Muneeb Shah (Derm Doctor) Grew a 14-Million-Strong Following on TikTok
The Secret to Trader Joe’s Success? Embracing This Japanese Business Strategy
Taxes on Small Businesses Across the Globe, Mapped: See Where Rates Are High, Low — and Nonexistent
How This Sister and Brother Co-Founded a $45.1 Million Revenue-Generating Sustainable Business
Norman Reedus Is Proud to Be the Weirdo-Whisperer: ‘Flaws Are What Make You Unique’
How to Position Yourself as the Go-To Expert in Your Niche
7 Easy Habits That Will Make Your Business More Sustainable (And Save You Money)